How carbon-rich are marine plankton?
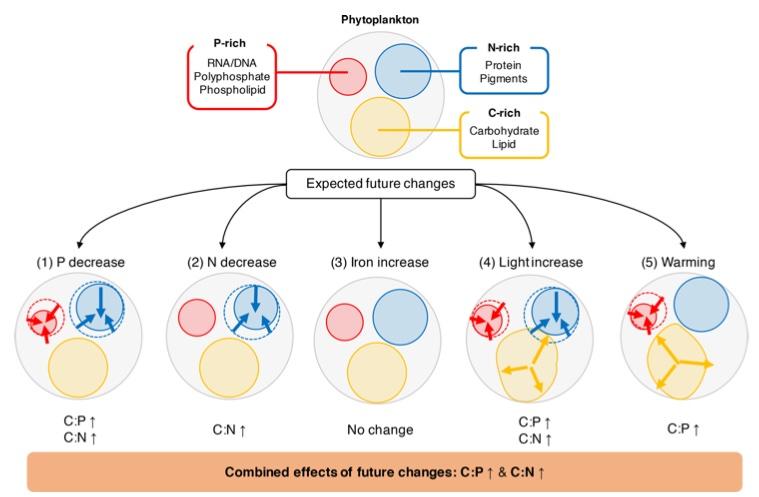
In the 1930s, A. Redfield demonstrated that the ratio of carbon, nitrogen, and phosphorus (C:N:P ratio) is nearly the same in some well-known marine plankton and seawater. This discovery led to the remarkable notion that biology controls the seawater chemistry. For many decades, the so-called Redfield ratio, C:N:P=106:16:1, has been a central tenet in oceanography. In recent years however, various data indicate that the phytoplankton C:N:P ratio is quite variable and has a discernible, large scale spatial pattern. This has enormous implications on the global carbon cycle. We are engaged in developing a new understanding of flexible C:N:P in both phytoplankton and zooplankton and their implications on the global carbon cycle under changing climates.
Why is dissolved organic carbon in the ocean so old?
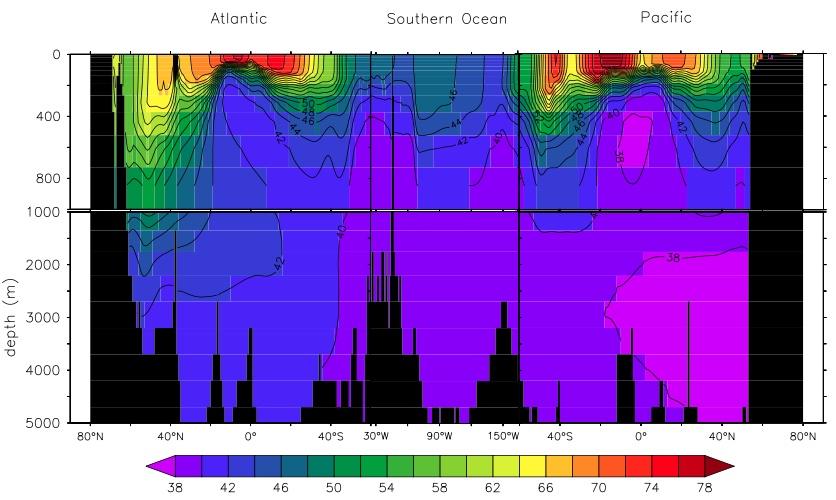
The dissolved organic carbon (DOC) is a large pool of carbon in the ocean. There are many different kinds DOC in terms of chemistry and structure. However, we know that the “fresh” DOC, those made recently by photosynthesis, is more abundant in the upper ocean, while DOC in deeper waters is not readily bioavailable. This so-called “refractory” DOC in the deep ocean tends to be more carbon-rich and very old (~6000 years). We are engaged in developing a new model of DOC in the ocean that can answer why the deep ocean DOC is seemingly refractory and so old.
What drove carbon changes during the Ice Age?
In the 1980s, measurements from Antarctic ice cores showed that atmospheric pCO2 varied by ~100 ppm in tandem with Ice Age climate variations over the past 800,000 years. pCO2 was low (~180 ppm) during peak glacial period and as high as the preindustrial level of 280 ppm during peak interglacial periods. It remains a great scientific mystery as to how atmospheric pCO2 could vary naturally by 100 ppm. We are engaged in numerical model investigations of this variation focusing on climate-marine biology feedbacks involving changes in ocean circulation, marine biology and biogeochemistry, and deep sea sedimentation.
How will carbon and climate evolve in the future?
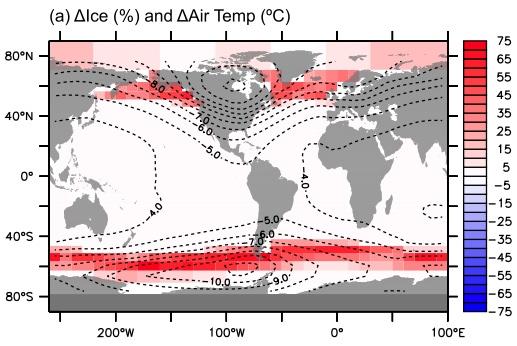
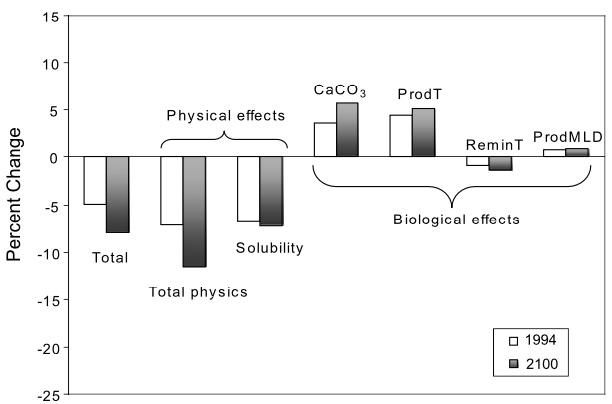
Fossil fuel burning and land use changes since the Industrial Revolution continue to emit large amounts of CO2 into the atmosphere.The accumulation of this anthropogenic CO2 in the atmosphere is leading to global warming, ocean acidification, and ocean deoxygenation. The severity of these environmental problems depends in part on the partitioning of the emitted CO2 between the atmosphere, oceans, and terrestrial biosphere. Using models and data analysis, we are engaged in quantifying this partitioning as well as the severity of some of the environmental problems.
How are the Great Lakes evolving under climate change?
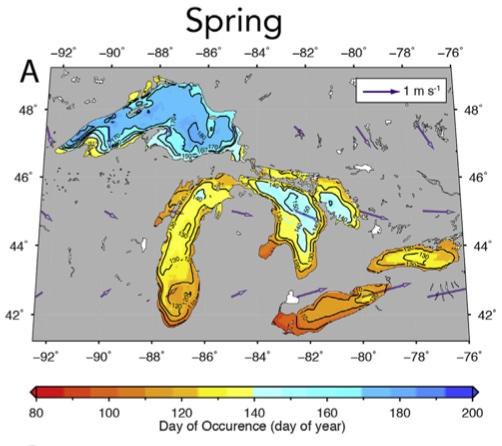
The Laurentian Great Lakes serve the surrounding regions with clean water, recreation, fish, transportation, and many other ways. They are undergoing warming today. The timing and spatial pattern of stratification and seasonal overturning are changing. Using numerical modeling and remote sensing, we are engaged in research activities that improve our understanding of how the physical and biogeochemical attributes of the lakes are evolving. Of the five Laurentian Great Lakes, we are focused on Lake Superior, which is closest to Minnesota.
